eCoral
Coral tracking system for KAUST

Overview
King Abdullah University of Science and Technology's Reef Restoration Initiative needed software to track 20,000+ coral specimens across laboratory tanks and ocean nurseries. The existing system relied on CSV uploads, causing constant data lag and errors. I redesigned the platform to mirror how researchers actually work: creating spatial interfaces that match physical nursery layouts and streamlining coral movements from a 15-minute process to under 30 seconds.
Client
DigyCorp
What I did
End-to-end Product Design, Design System
Timeline
Q2 - Q3 2025


The Problem
When I joined the project, I found a system that technically displayed data but gave researchers no way to change it. The existing dashboard showed tanks, corals, and nursery layouts, but every edit required downloading a CSV, opening it in Google Sheets or Excel, modifying the data manually, and uploading it back. Something as simple as moving one coral from one tank to another took 15 to 20 minutes. At a scale of over 17,000 coral fragments spread across 300+ tanks in three separate nurseries, each carrying complex metadata like species, genotype, growth stage, health status, and disease flags from AI powered camera monitoring, researchers were spending more time on data entry than actual restoration work.
Defining the structure
Researchers think systematically and spatially about the nursery: "Array A, Tank 3, Tray 19, slot B4". The interface I've designed follows the same structure, mirroring the building hierarchy so finding a coral on screen feels like finding it in the lab.
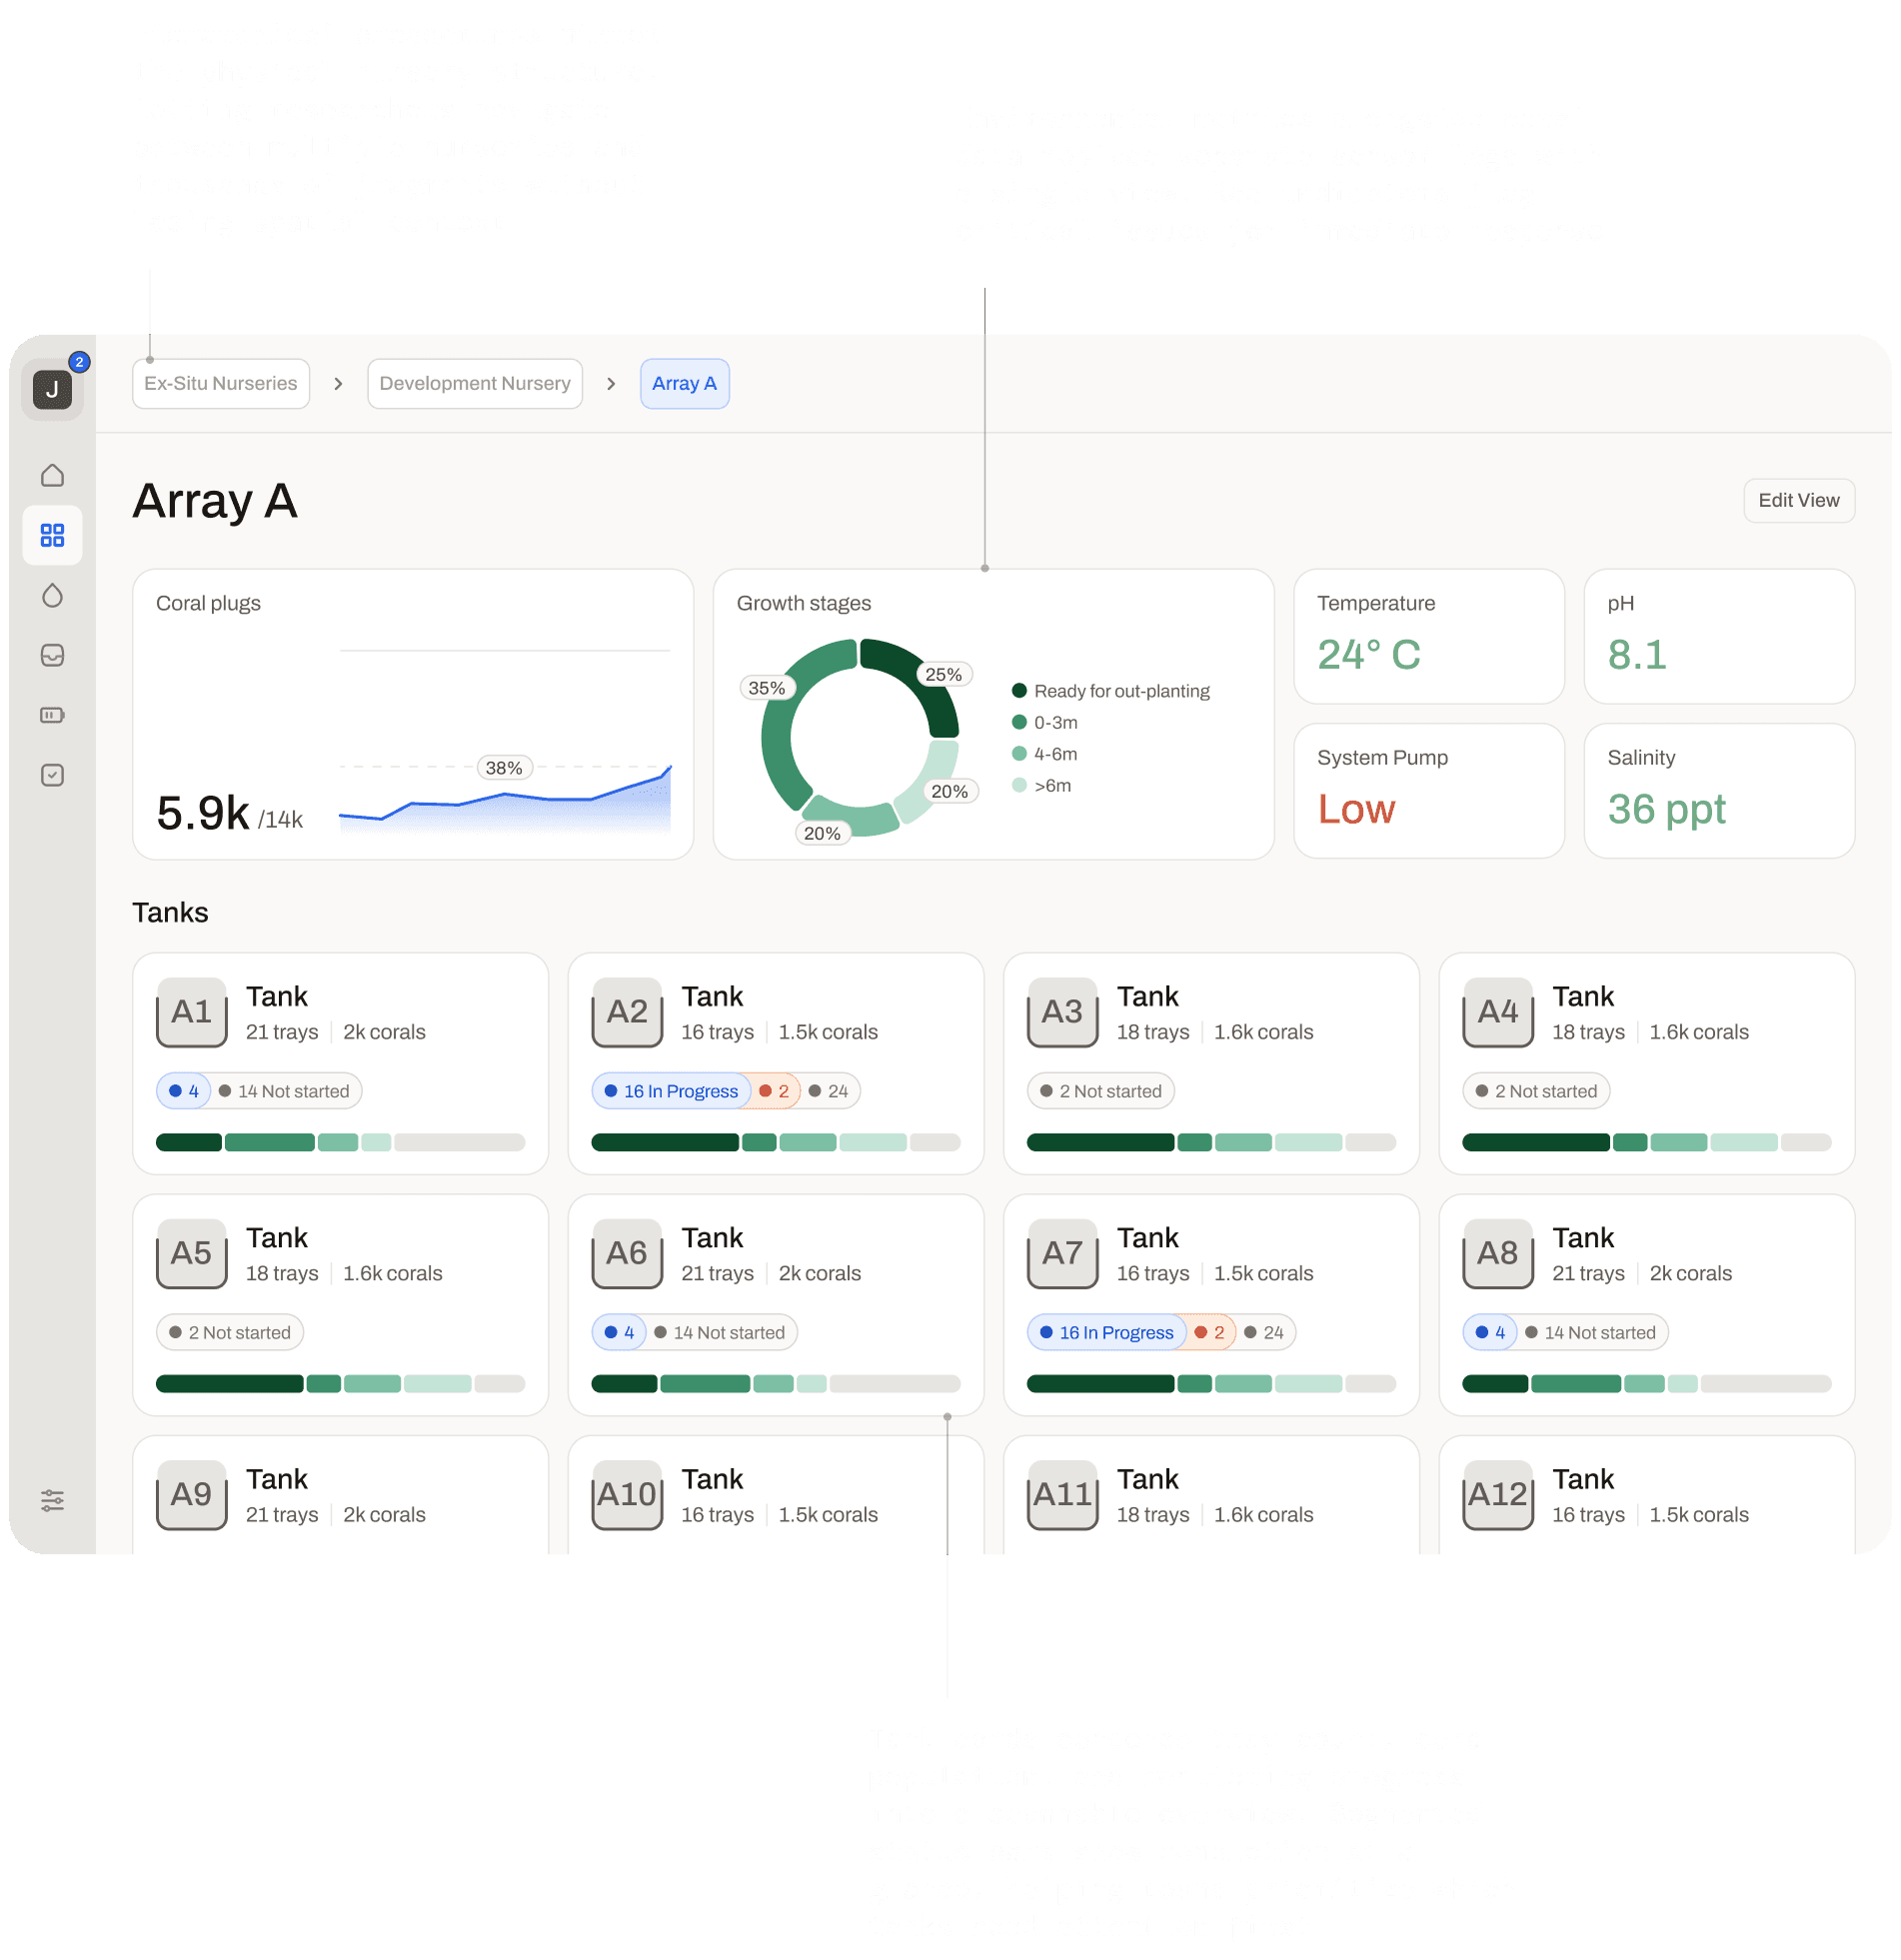
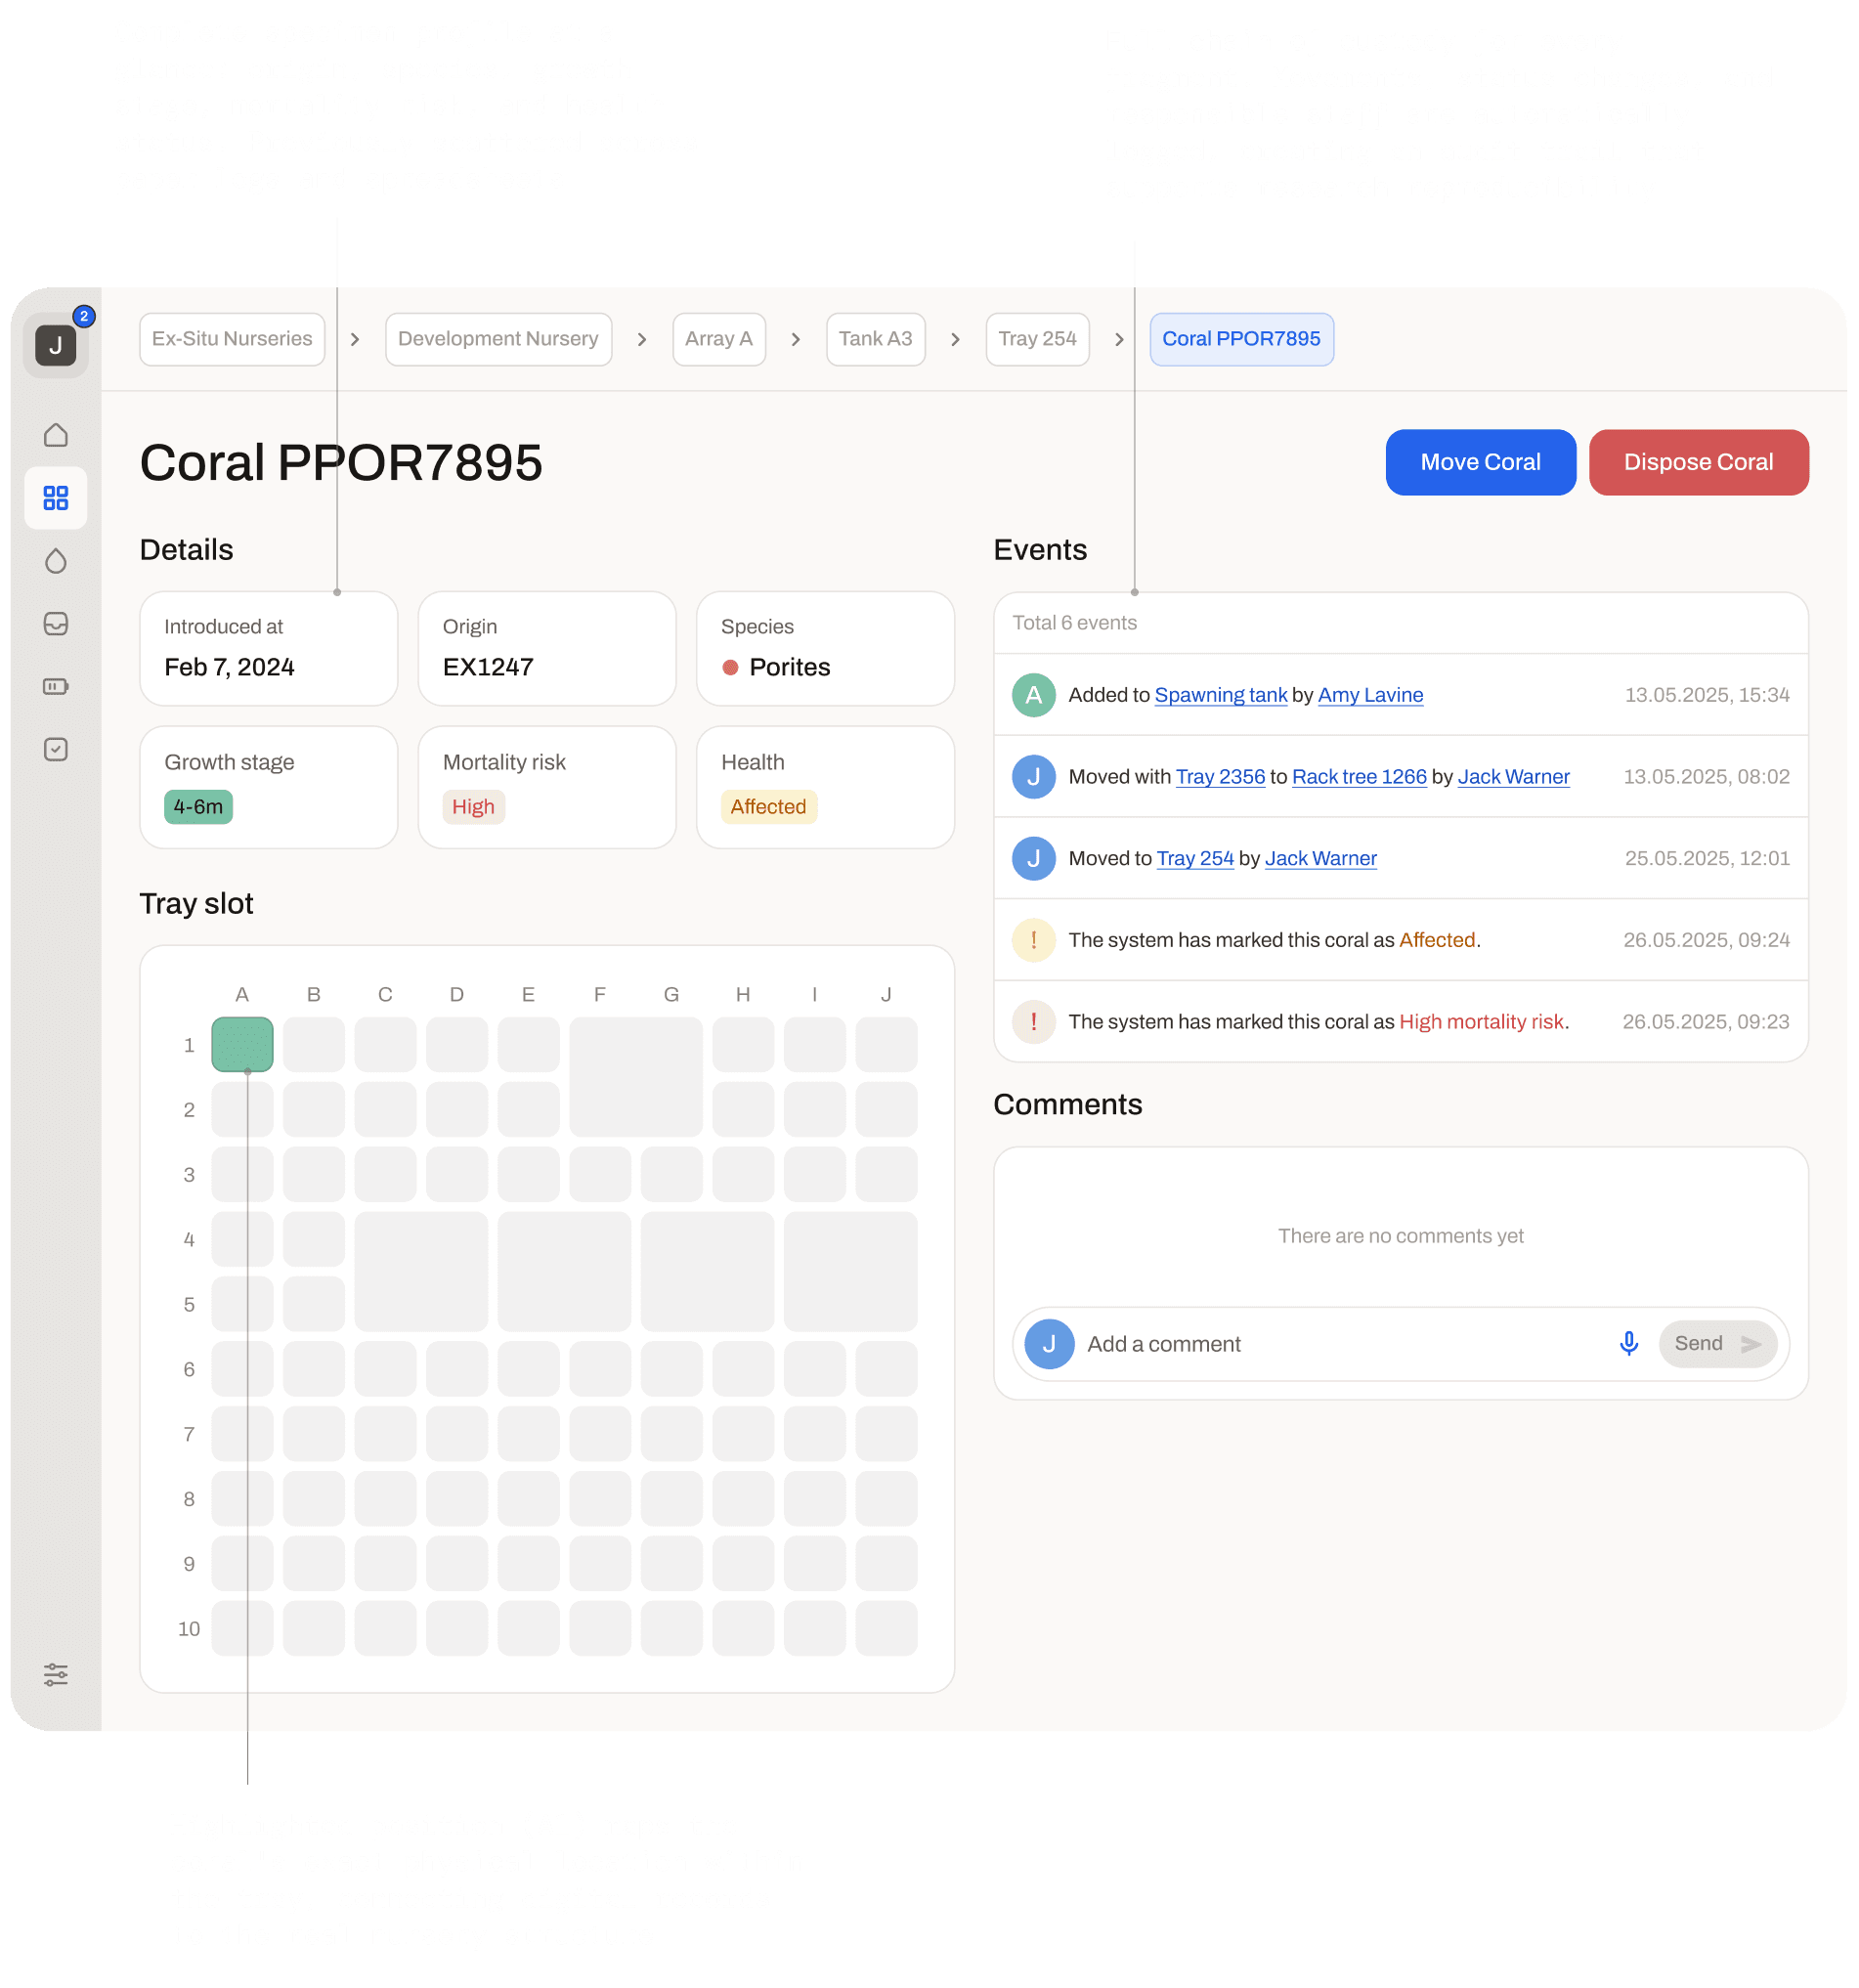
Each coral has a digital twin
Each coral in the system carries its own profile showing growth rate, mortality risk, and health status. Cameras mounted in each tank photograph the trays every hour, and an AI image recognition system analyzes the photos to update these metrics automatically. The researchers can see at a glance which corals are thriving and which ones are at risk.
Fixing a broken flow
I spent the first week on site purely observing, how the nurseries were structured, how corals moved between tanks and from ocean to land, what data researchers tracked, and where their workflows broke down. Most of the researchers kept surfacing one issue: moving a coral digitally was usually taking more than moving it physically. So everything started around fixing that core problem, everything else followed. I mapped out the existing processes built around CSV files and manual updates, then designed new flows that eliminated the friction points I'd observed.
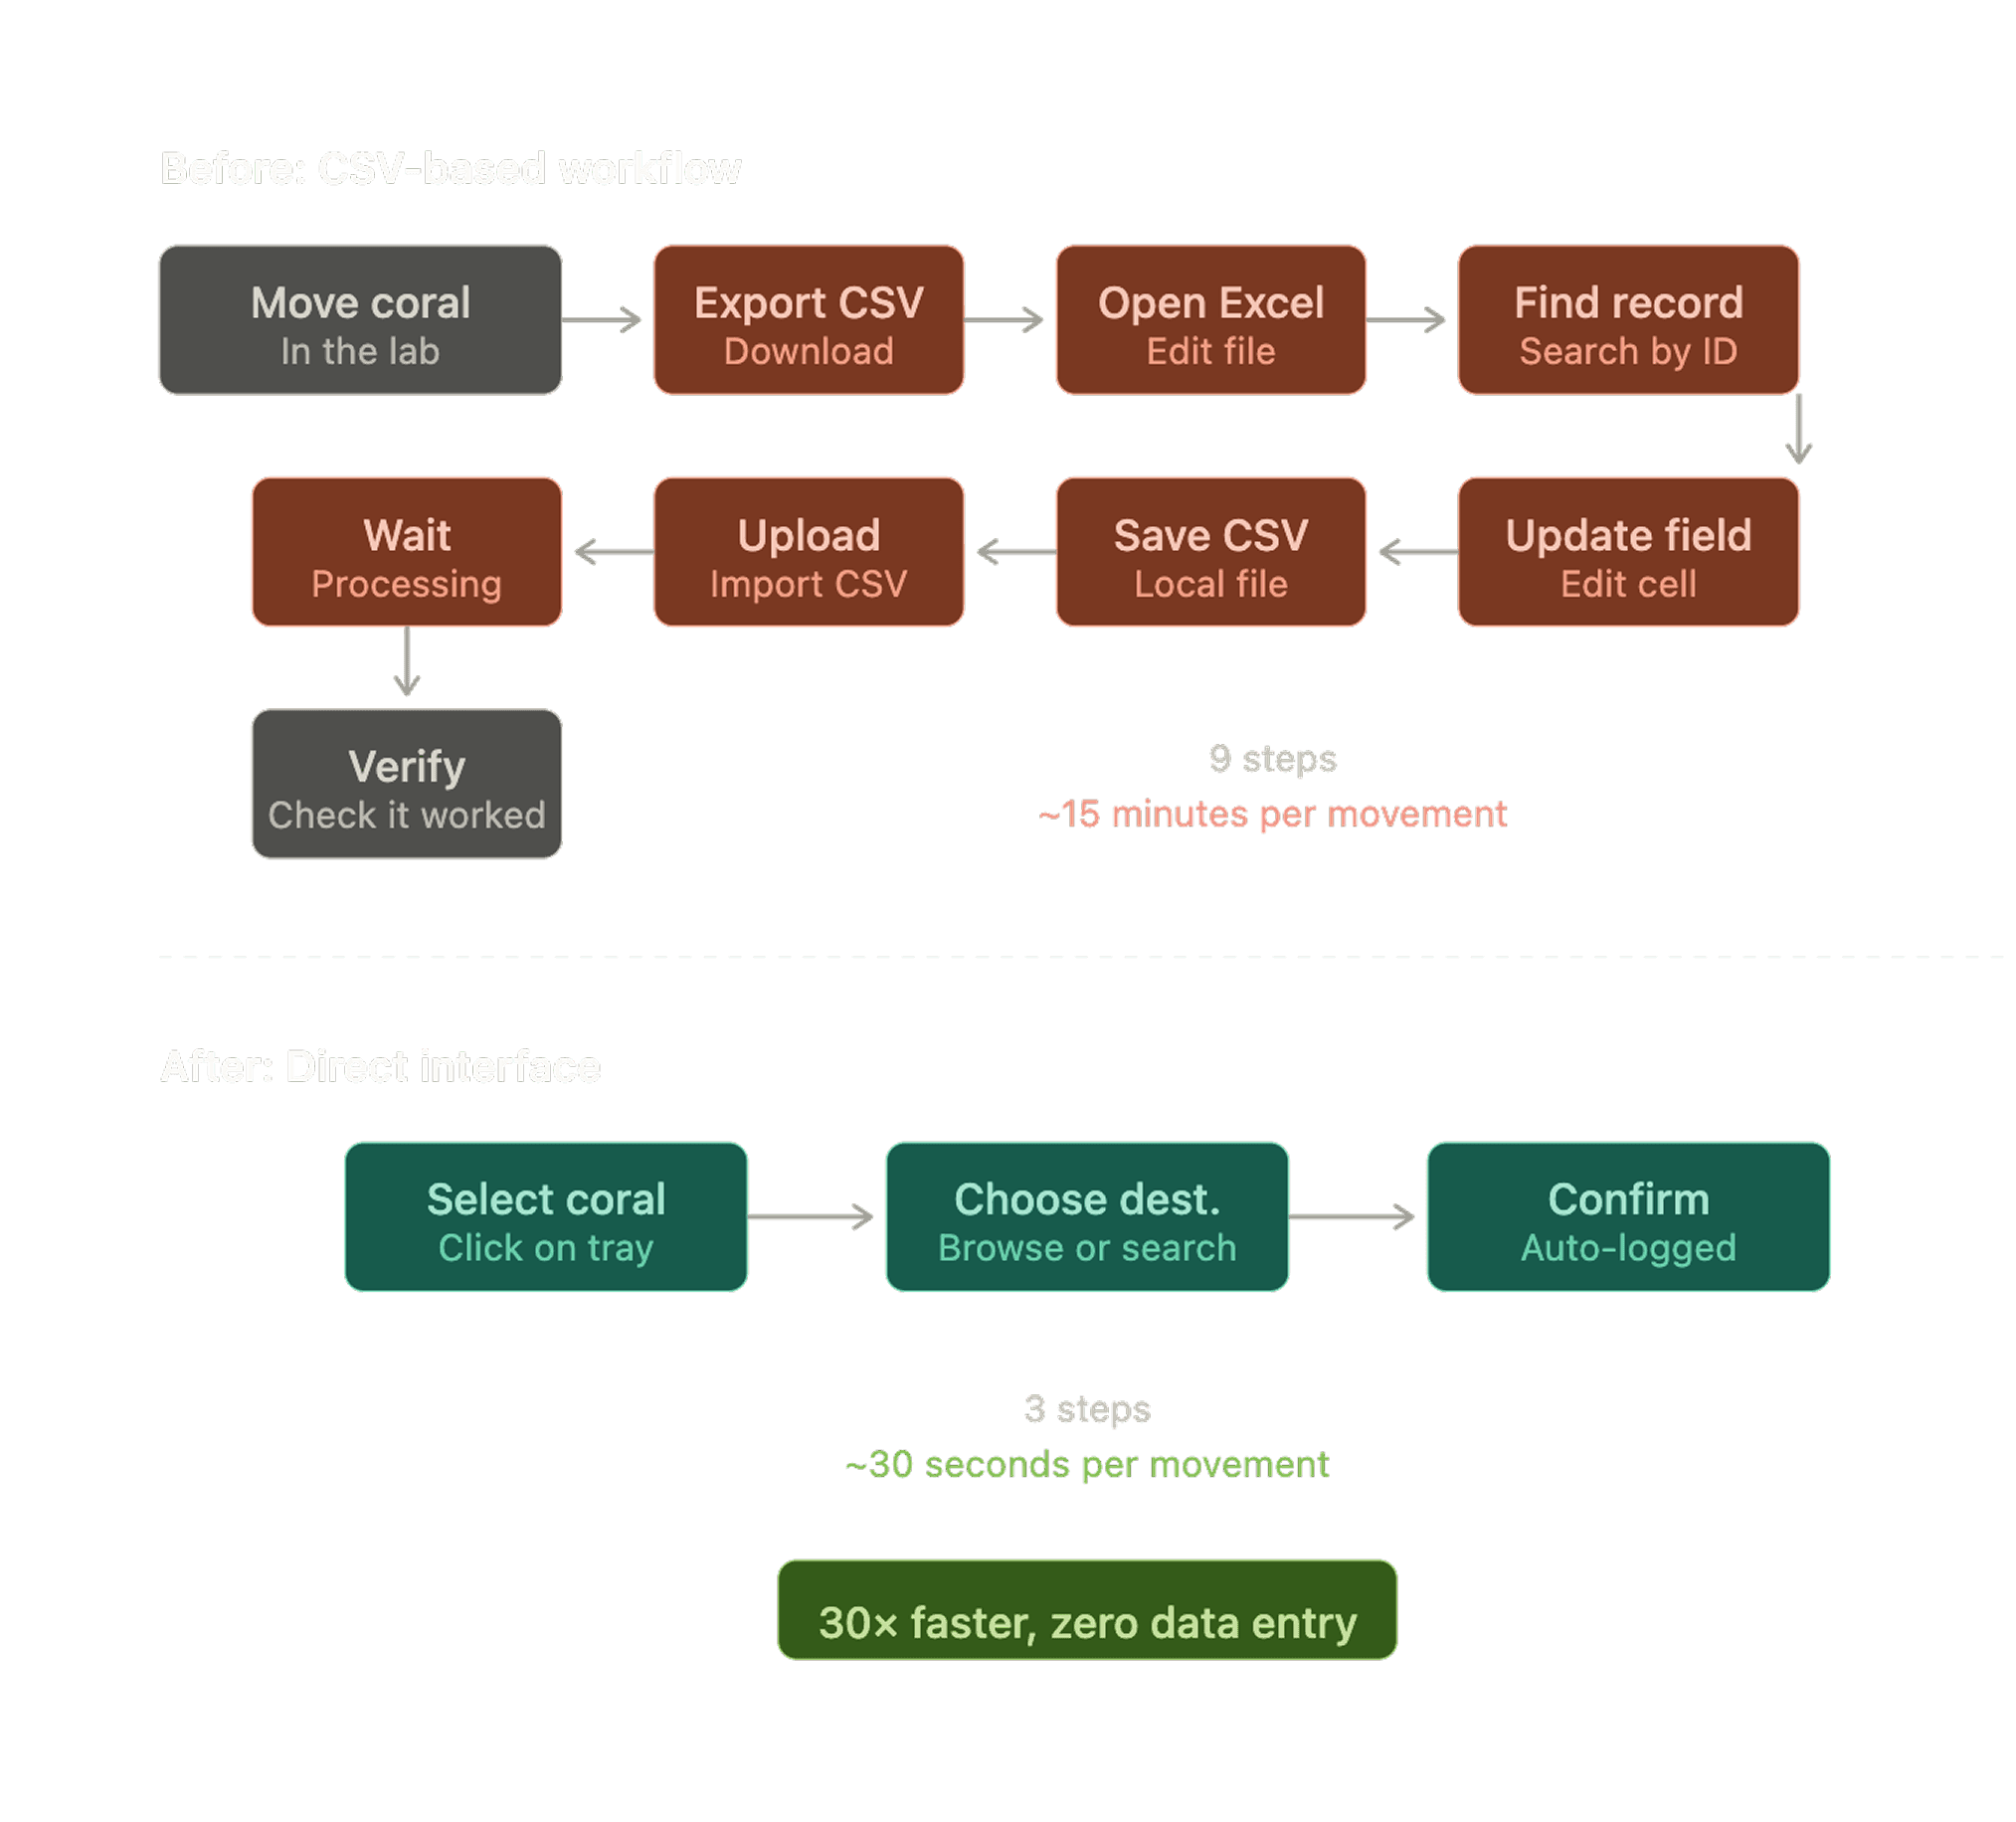
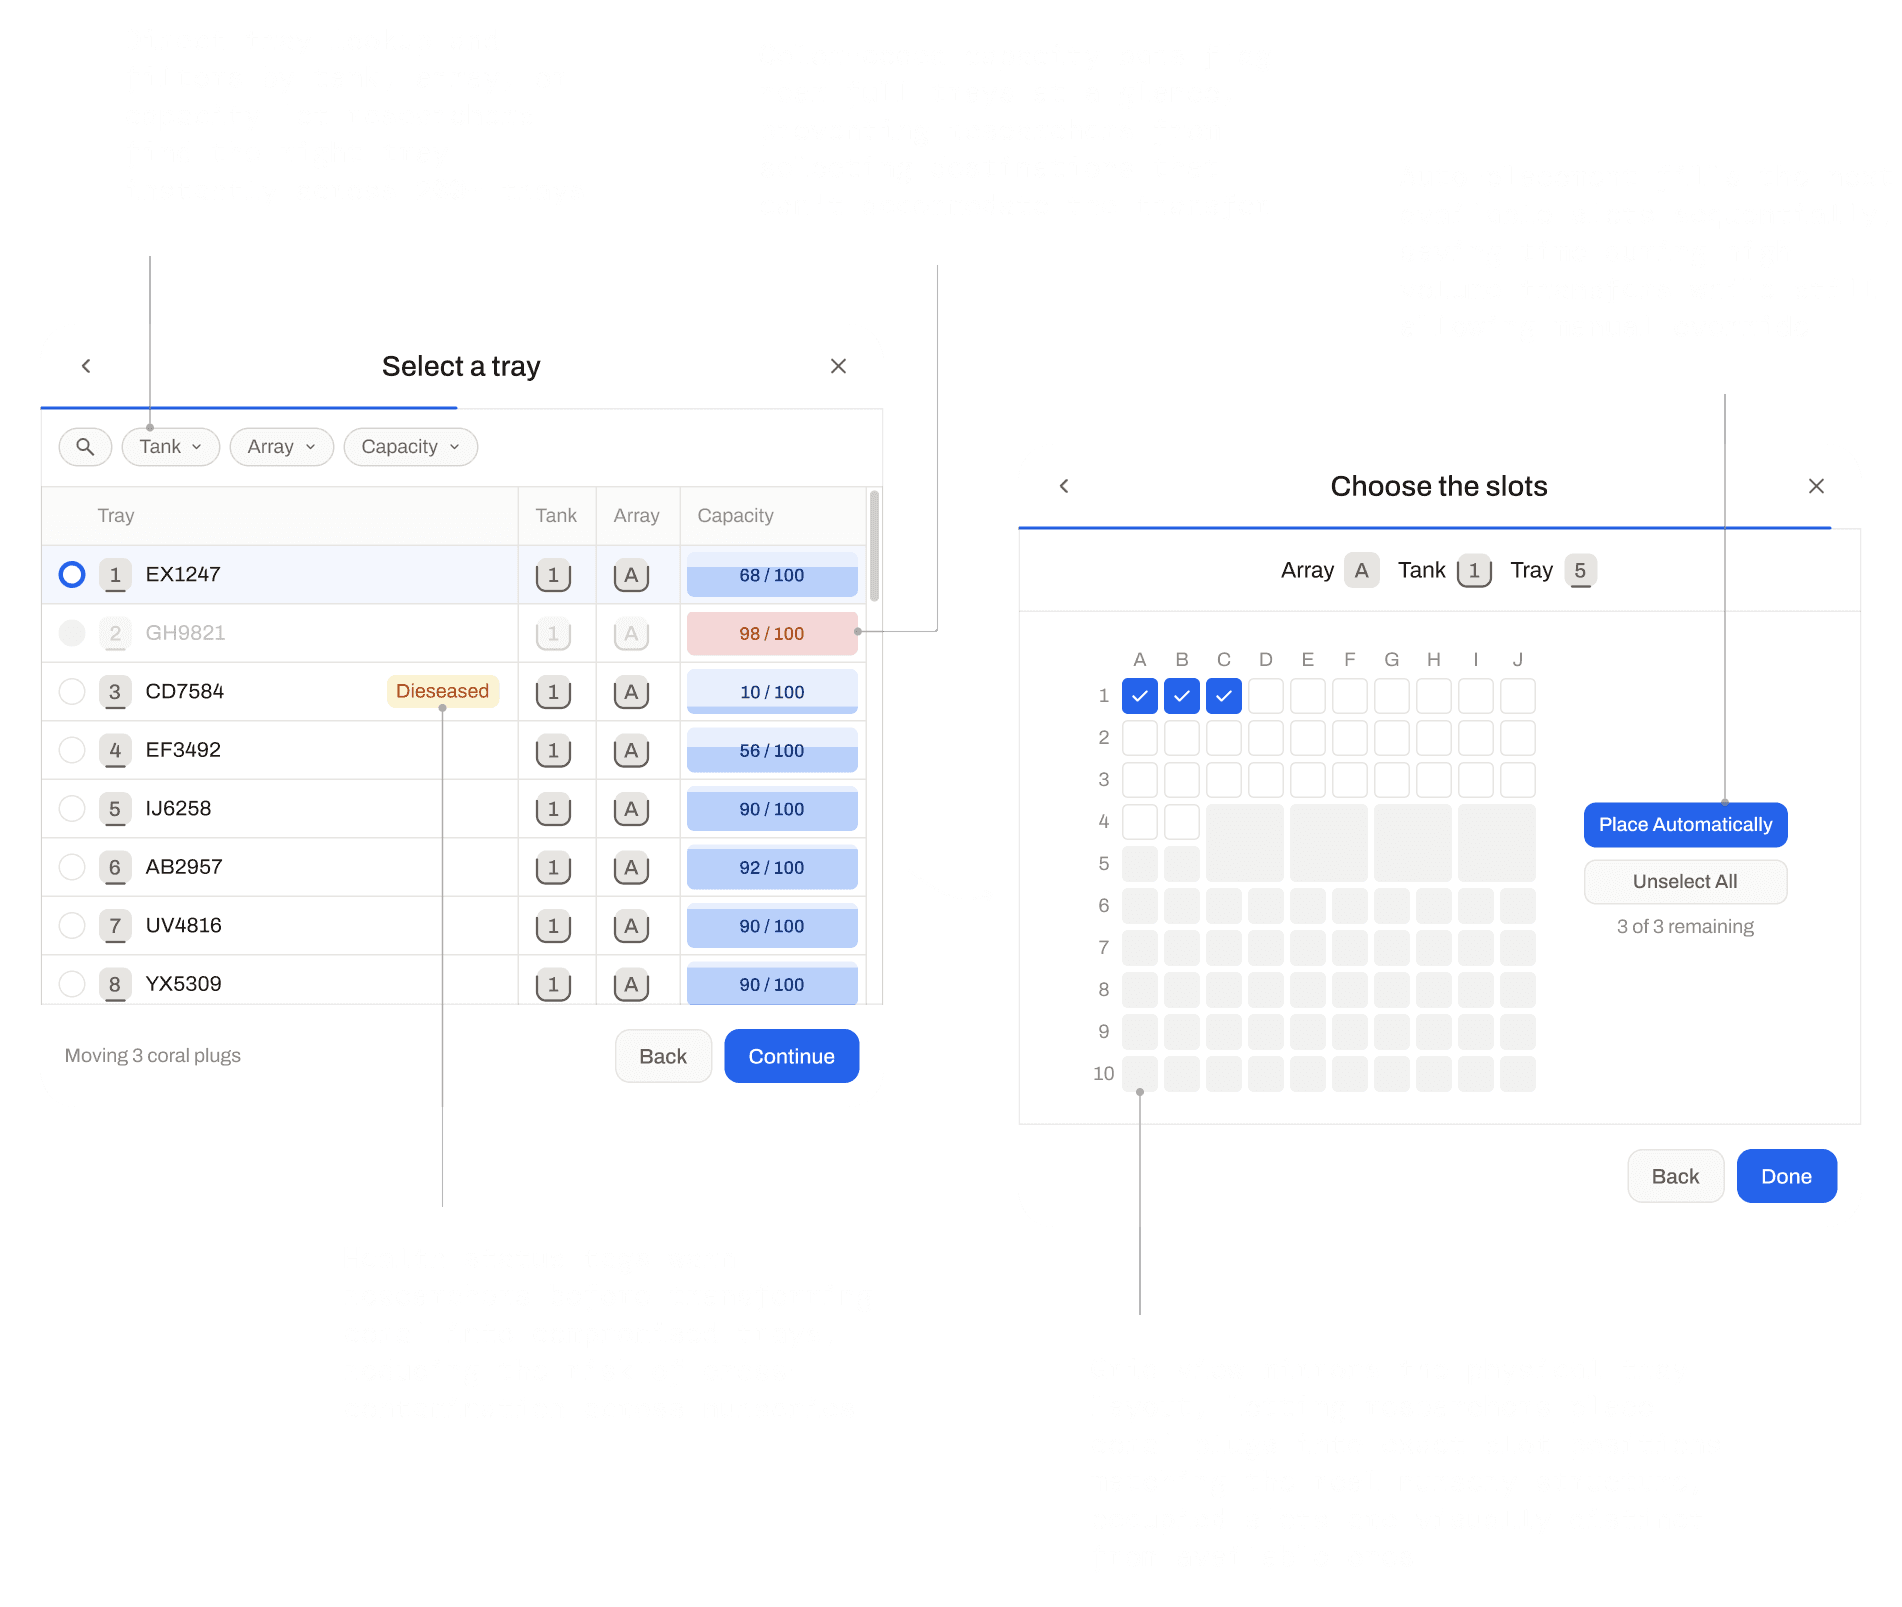
The new flow enabled the researchers to move corals in the system much faster. Select the coral, choose a destination, confirm. The system handles the rest, from logging the movement, updating the record, and maintaining the audit trail automatically.
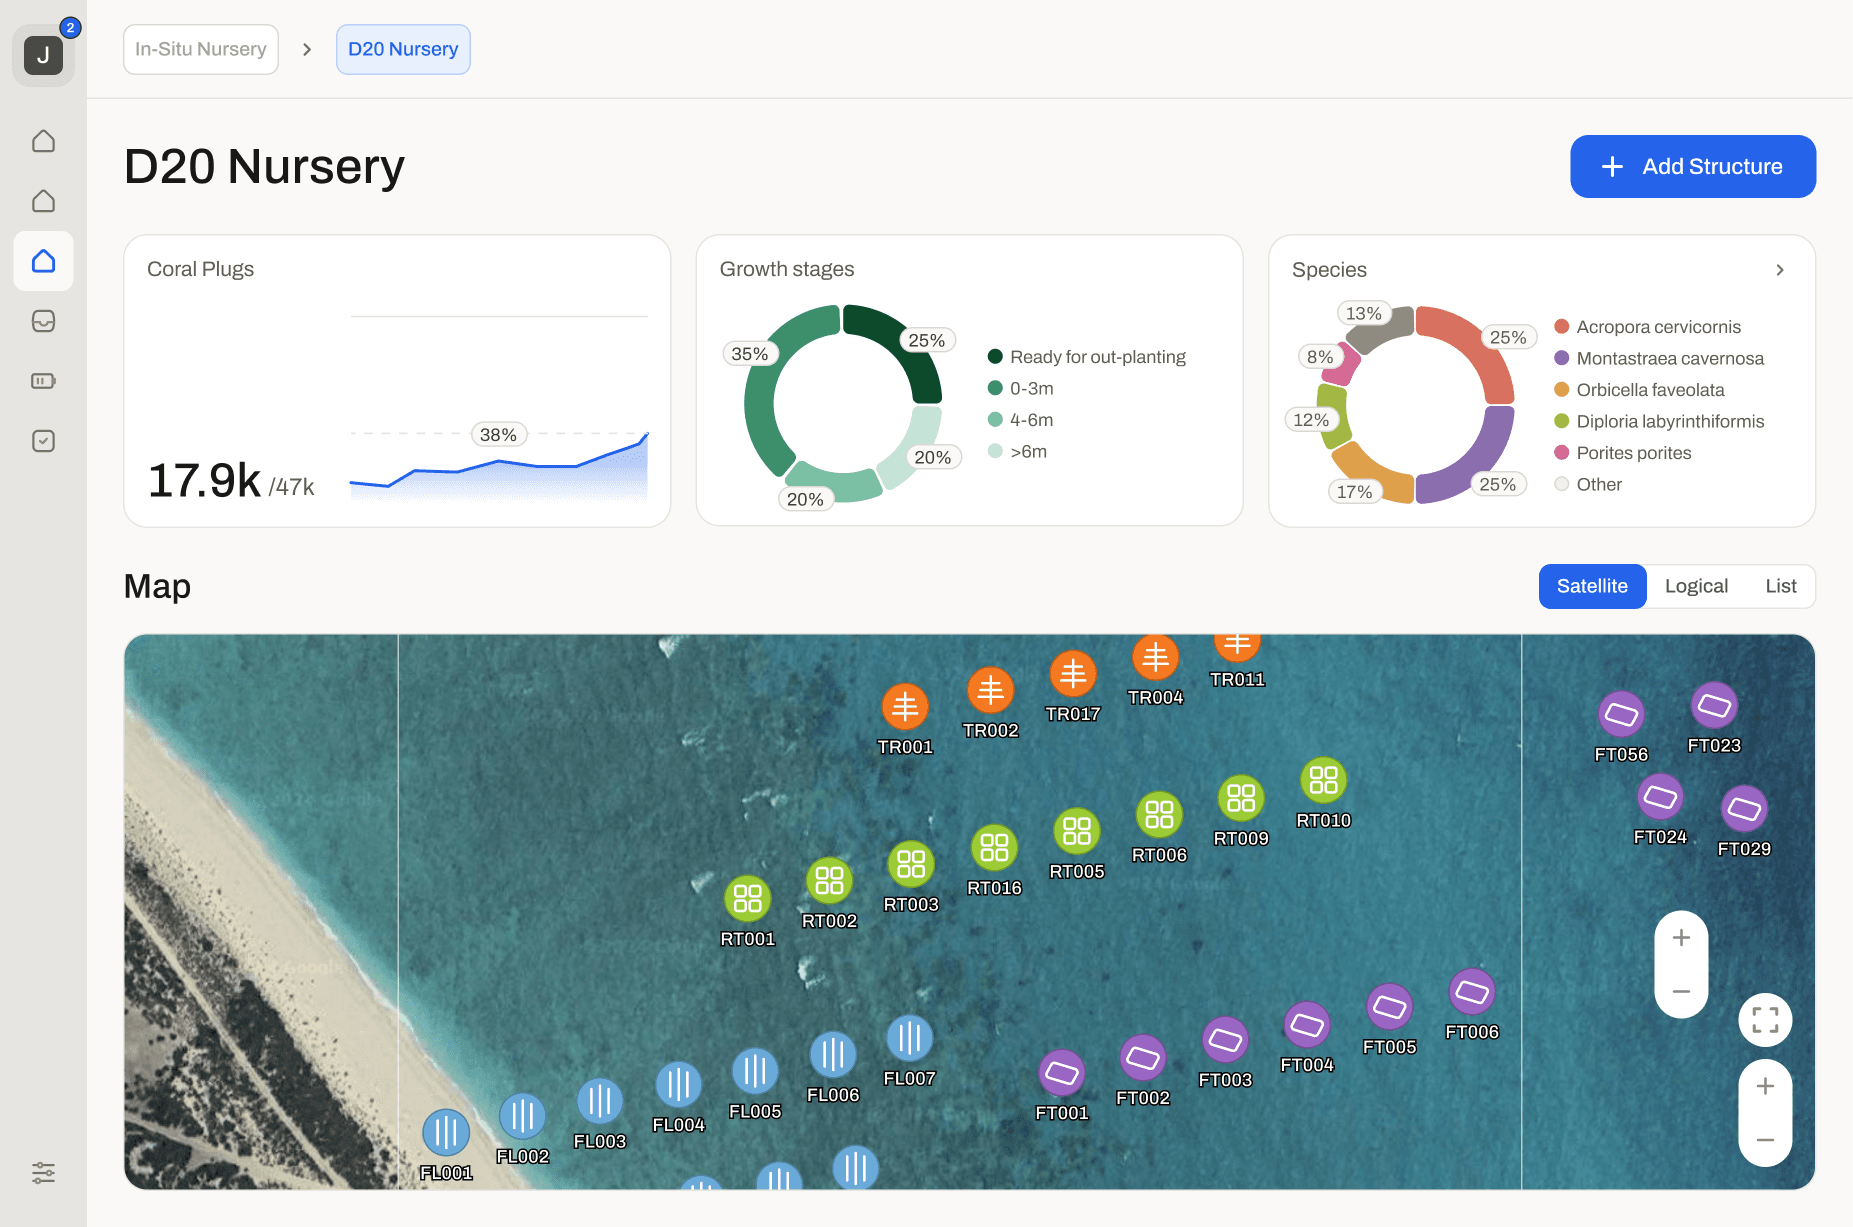
Bringing the ocean into the interface
In-situ nurseries presented a different challenge. Unlike laboratory tanks, ocean sites are scattered across a coastline and researchers needed to see where things were geographically. The in-situ view combines a map with a list showing status and capacity for each site. Icons distinguish between structure types using the same visual language the team already uses in their planning documents.
The outcome
The system launched in late 2025. The researchers told us that what used to take 15 minutes now takes under 1 minute, a 15x speed-up. More importantly, they trust the data now, the accuracy jumped to near-perfect. Admin time dropped too, what used to require constant manual cleanup is now largely automated, cutting working hours from 4h to 1h daily, a 4x reduction.
15x faster
Coral transfers
4x less
Admin time

